The 2023 Instagram Benchmarks Report

Introduction 

Join our newsletter

Instagram has kept us all busy over the past year.

If you work in social media or marketing, knowing what’s happening on Instagram is a must. But with the number of new features and updates they rolled out in 2022, it might’ve been more challenging than usual.

While some of the changes may seem minor, they’re a part of Instagram’s wider strategy to become a video entertainment platform. All this can alter what their algorithm prioritizes, and impact your influencer marketing strategy and performance.

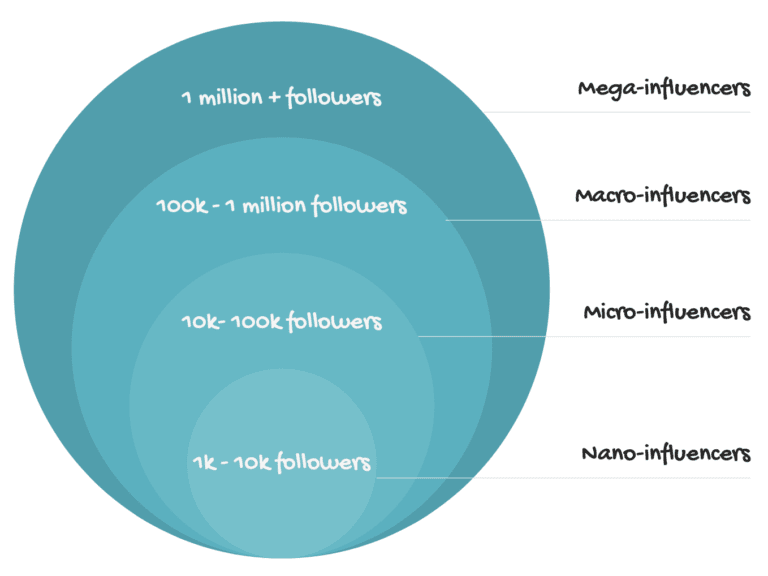
So as you plan your influencer activations — ask yourself: Who are the influencers you should be working with? What content formats should you invest in? What results can you expect?

To help, we analyzed nearly 3 million Instagram posts and Stories, to draw real insights that will help you start 2023 on the right foot. The data we use in this Instagram Benchmarks Report comes directly from Instagram, meaning it’s reliable and accurate.

Without further ado, let’s dive in!

Key findings

  • Micro-influencers experienced the highest growth in reach rate for Instagram posts, at 11%.
  • Influencers across all tiers — from nano- to mega-influencers — got between 9% to 17% lower engagement rates on average.
  • Out of the different types of posts on Instagram, Reels came out on top as the type that gets the most reach. But it also gets the lowest engagement.
  • Macro- and mega-influencers saw an average growth of 19% in reach on Instagram Stories.
  • Stories that start with images, compared to videos, generally have a higher retention rate and a lower exit rate.

What are Instagram performance benchmarks?

Instagram performance benchmarks show how the average influencer performs on Instagram. The benchmarks work as a standard for success, which you can use to: 

  • Select influencers to work with, by evaluating whether they’re performing as they should 
  • Set realistic goals, by calculating what kind of results you can reasonably expect from influencers of different sizes across content formats
  • Evaluate the success of your activations, by comparing the influencers’ performance to the benchmarks
  • Improve future activations, by identifying and replacing low-performing influencers

Instagram performance benchmarks are important for your influencer marketing efforts. They provide you with the context you need to understand your results and determine whether you’ve delivered a positive ROI. 

In this report, you’ll find benchmarks for the following metrics: 

Instagram posts: Reach rate, engagement rate, and engagement-on-reach rate.

Instagram Stories: Reach rate, exit rate, tap-forward rate, and tap-back rate.

Influencer marketing glossary

To understand the benchmarks in this report, here are a few key terms and definitions you need to know!

  • Influencer tiers:
  • Reach: The number of people who’ve seen the content created by influencers.
  • Engagements: The total number of likes, comments, saves, and shares influencers’ posts receive.
  • Reach rate: The percentage of users that sees influencers’ content compared to the number of followers they have.
  • Engagement rate: The amount of interactions influencers receive on their content compared to the number of followers they have.
  • Engagement-on-reach rate: The number of interactions influencers receive on their content compared to the number of people they reach.
  • Exit rate: The percentage of viewers that left influencers’ Stories before they were finished. 
  • Tap-forward rate: The percentage of viewers that tapped forward to see influencers’ next Story frame. 
  • Tap-back rate: The percentage of viewers that tapped backward to see influencers’ previous Story frame again.

Want to take your brand to the next level? Let’s talk.